Get the essentials of your P2P traffic with Admin Panel delivered to you by Vidict Media Server
Vidict Media Server Admin Panel with all P2P statistics
Each user of Vidict Peer can get valuable insights about the traffic running through the P2P network of end-viewer devices thanks to the features of the admin panel designed by Vidict Media Server. In this blog, we explain all the functionalities of the panel, in a step-by-step manner.

After logging in with your email and password you can see the main page with all the statistics about the P2P traffic.
The integration of Vidict Peer is a simple, two-step process described in a separate part of the admin panel. In short, the user first needs to copy-paste two single-line javascript files in the head tag of the web page where the video is embedded. Next, the user is required to select the type of his player and integrate vidictLoader with the corresponding variable in the player configuration.
The panel is showing the total amount of bandwidth consumed for delivery of video but also provides data on video transferred by the P2P network, opposite the amount of video delivered directly from servers.
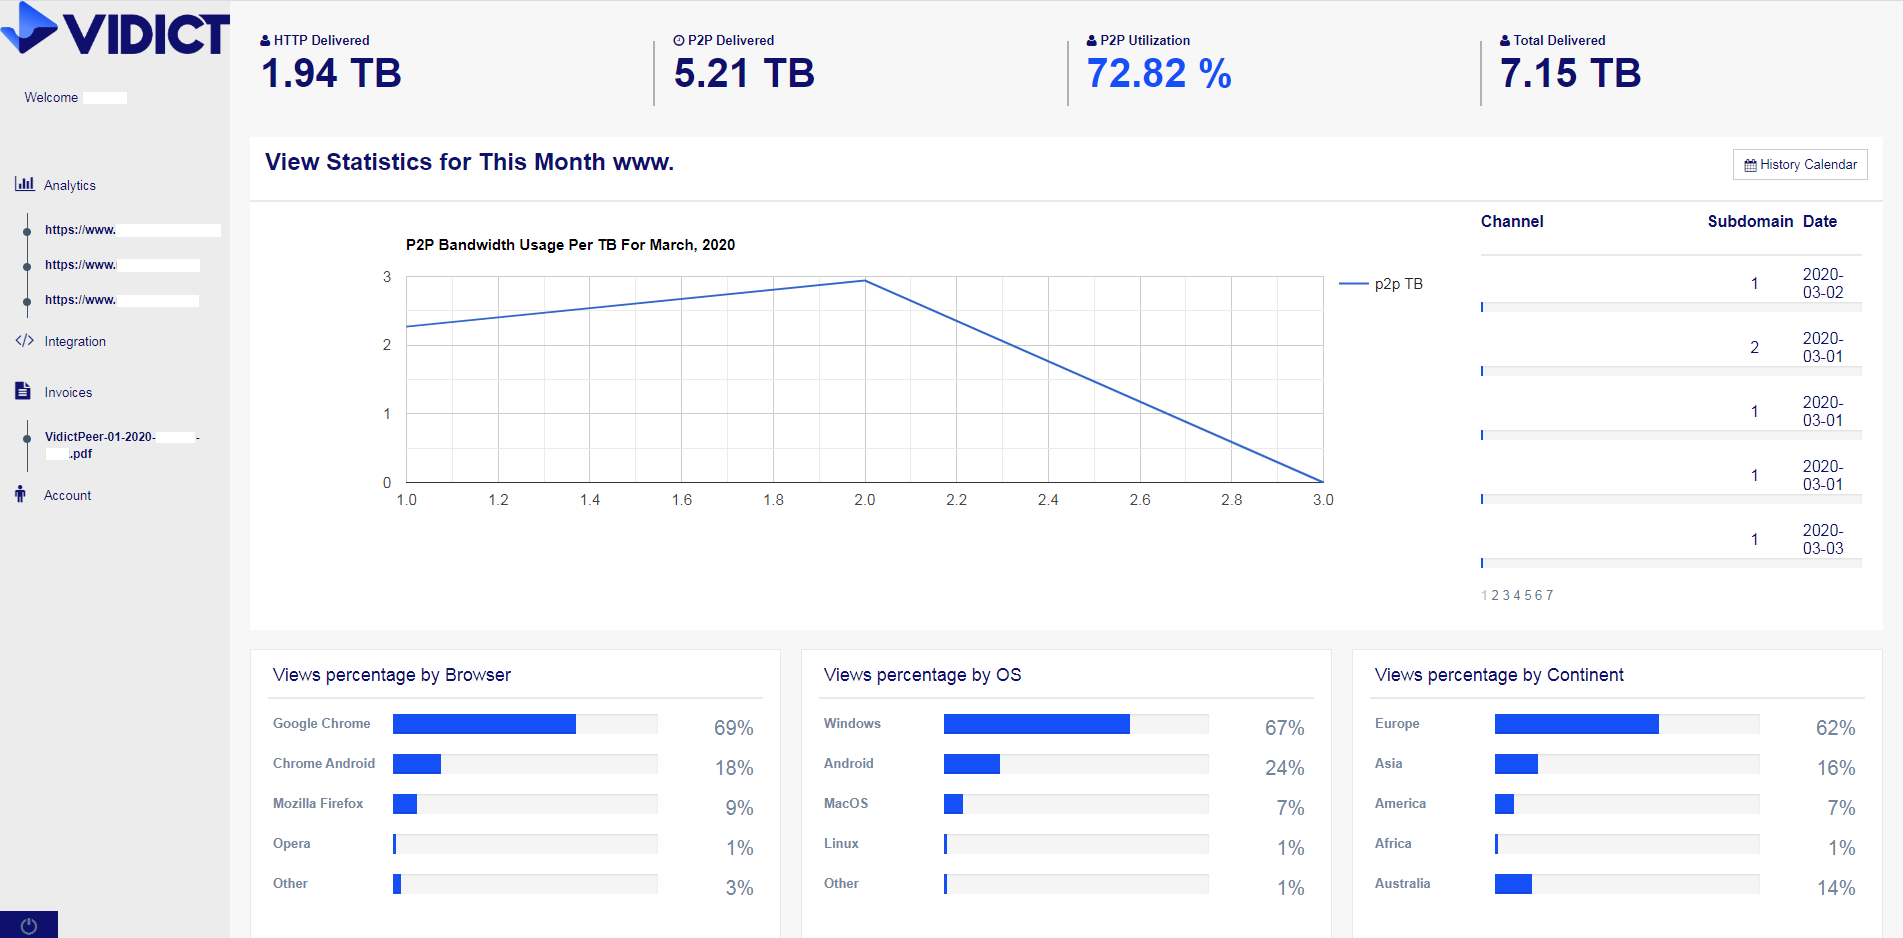
Analytics Overview: For users who have more than one domain on their Vidict Peer Account, the statistics are provided on a domain basis.
The History Calendar offers an option for getting the statistics concerning different periods of Vidict Peer deployment, starting with P2P bandwidth usage on the current date, the previous day, the last 3 days but also weekly, monthly, yearly statistics, all the way to the beginning. In other words, History Calendar is a tool for segmenting the statistics regarding a particular period of Vidict Peer usage.
The percentage of P2P network utilisation which is equal to the saved server bandwidth for the selected period is also measured. The data for TB of peer-to-peer bandwidth is presented in a graph that is very convenient for getting a clear picture of the peaks in viewership.
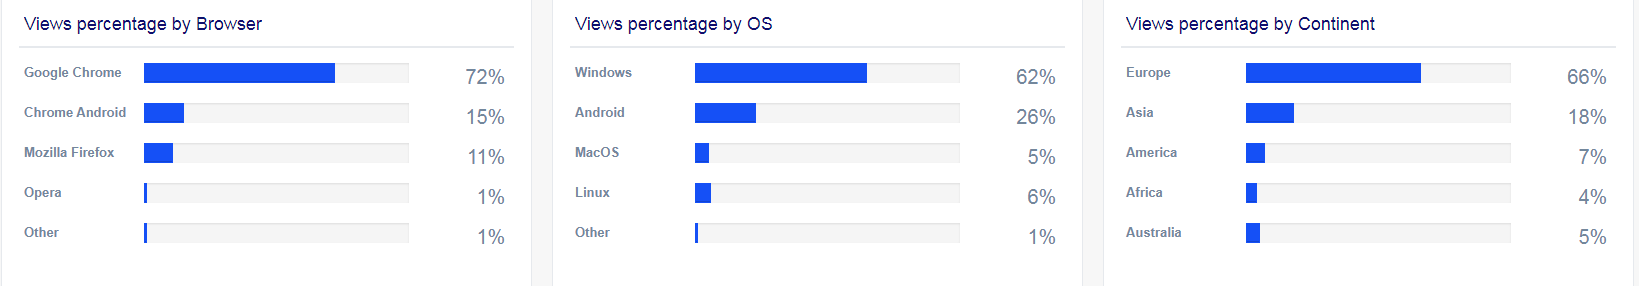
We are classifying the viewers by Browser type, Operating System, and Geographic origin as well.
Moreover, the views on a P2P network are segmented by Browser type, Operating System on and Continent, so one can get a clear picture of viewer location and viewer device. Depending on the selected package each user account is charged for the amount of monthly P2P traffic. The invoices are generated in pdf format and can be viewed by clicking on the "Invoices" feature located on the left side of the panel. The payment of the due amount can be done with a credit card enhancing in that way overall customer experience. Any questions regarding the payment are referred to the account manager.
For any questions regarding Vidict Peer admin panel, you can contact our support team at info@vidict.net.